AXIS.
AXIS is a fictional business scenario created by CODEVILLE to demonstrate a data integration and business intelligence approach. Interfaces, organizations and sample figures shown here are illustrative and do not represent a client engagement or measured business results.
The data exists.
Just not in one place.
Sales, finance, customer and operational information often lives across different applications, databases and spreadsheets. Reporting then becomes an exercise in collecting data before anyone can analyse it.
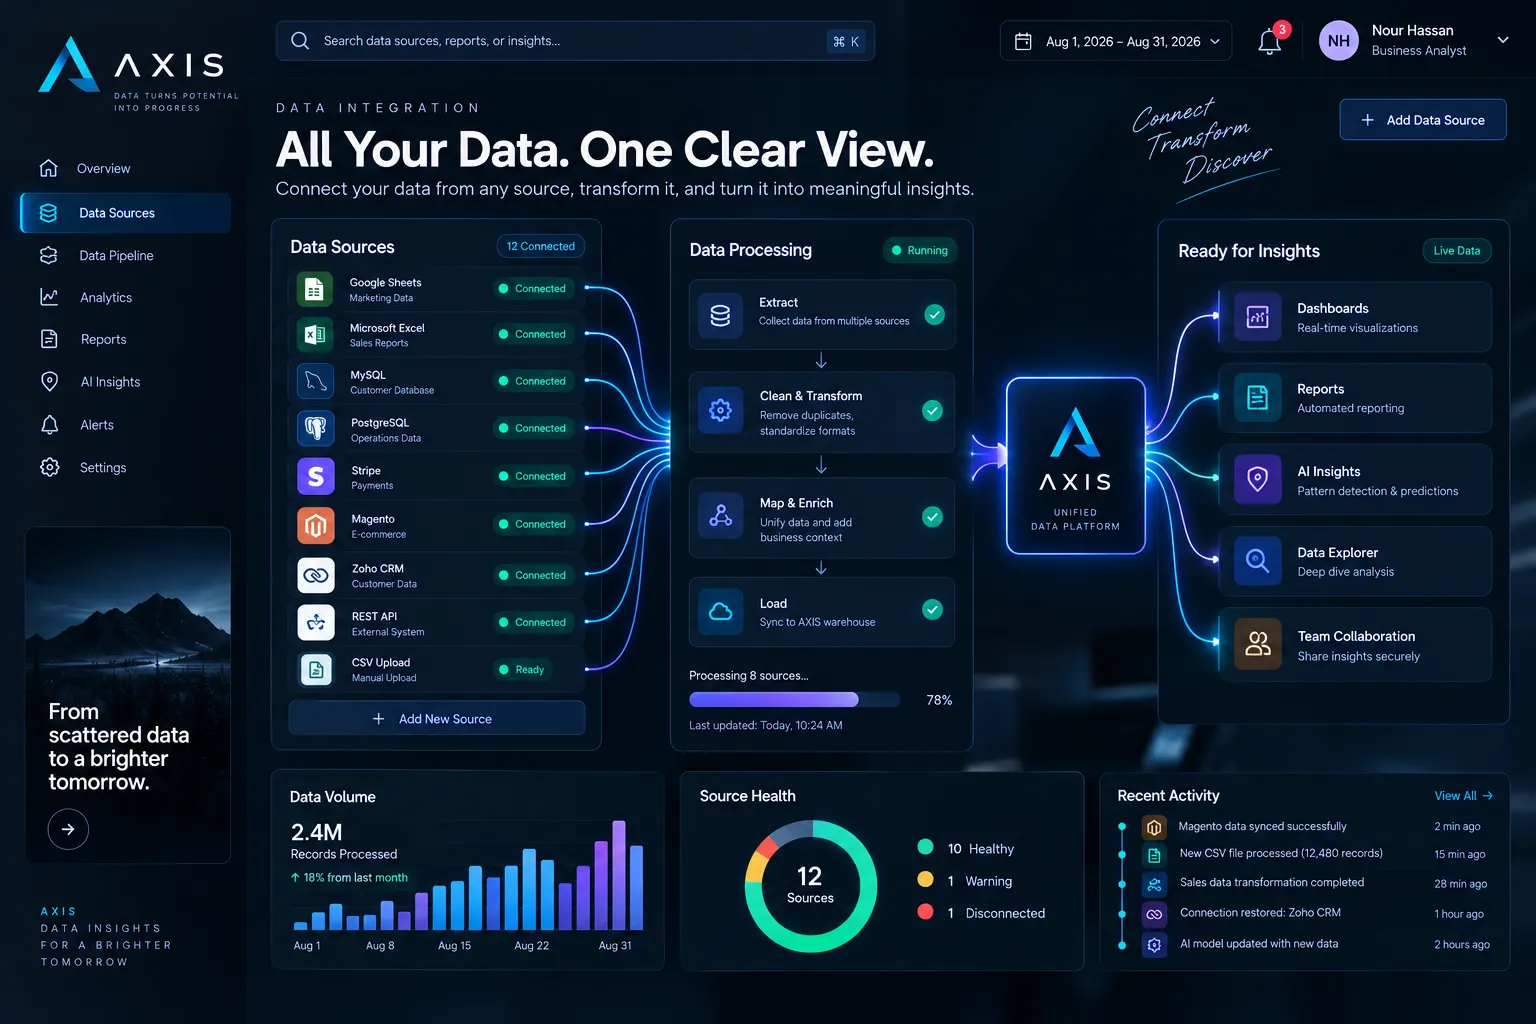
Before the dashboard, build the data flow.
AXIS starts below the visualization layer: connecting sources, transforming records and creating a consistent data structure that reporting can rely on.
One business.
One analytical layer.
Once information is mapped into a shared model, different teams can work from the same definitions instead of rebuilding reports from separate files.
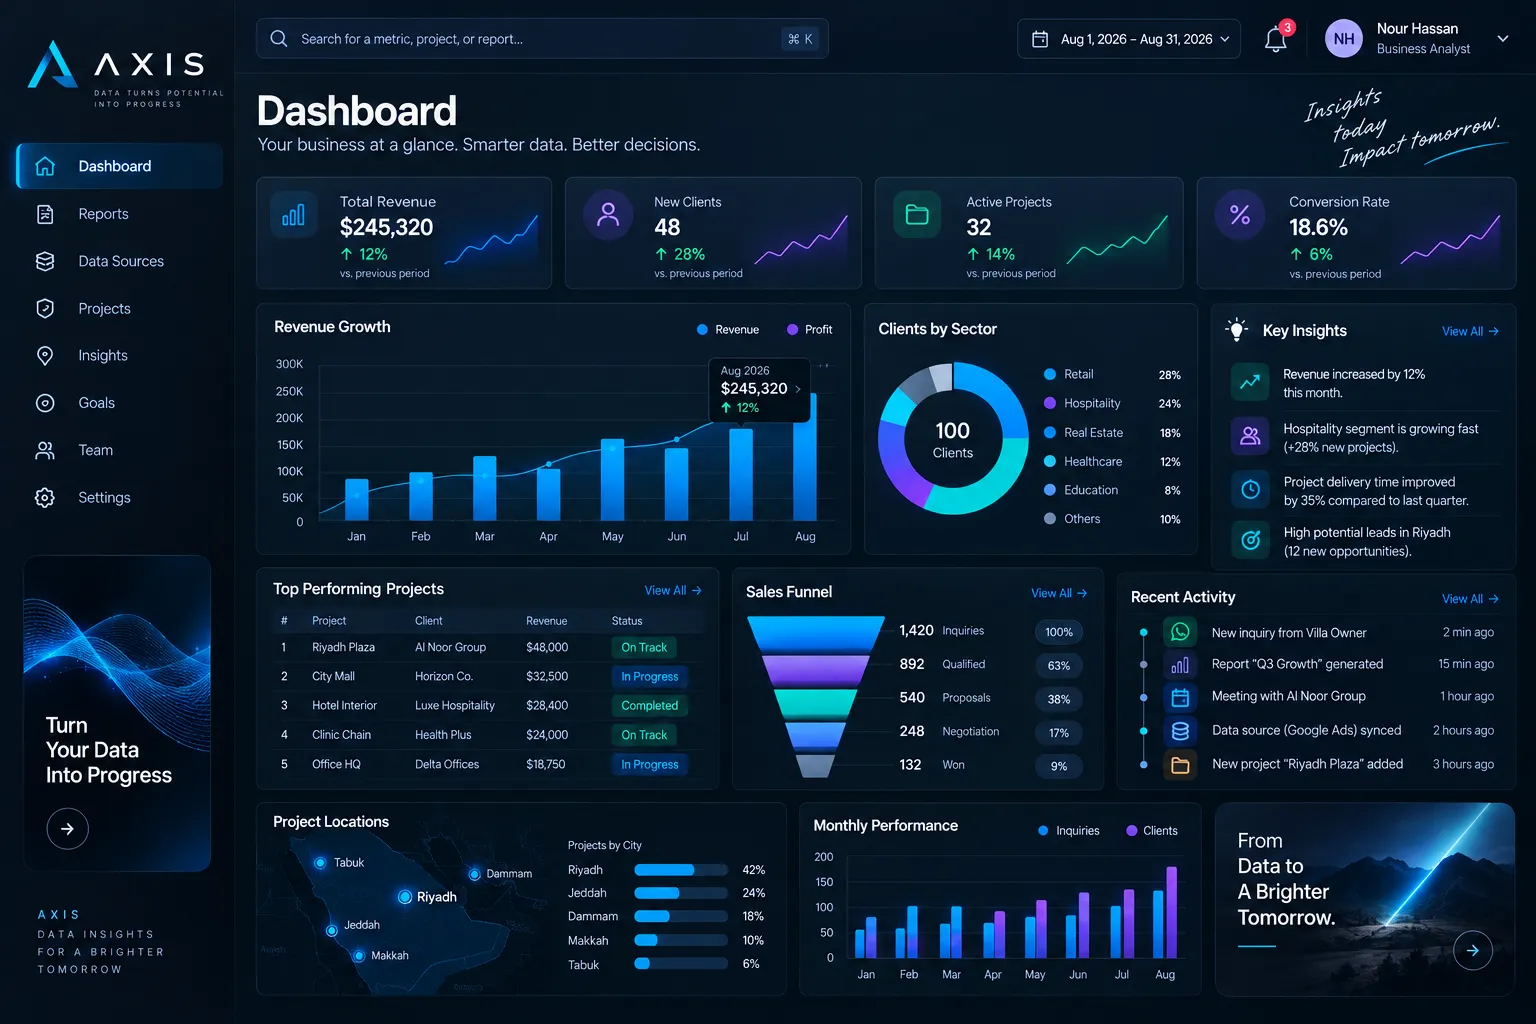
Different questions need different views.
A useful BI system is more than one management dashboard. It should support reporting, exploration, operational analysis and deeper investigation.
Management View
High-level indicators and trends for business oversight.
Operational Analysis
Drill into the activity behind the headline numbers.
Data Explorer
Investigate records and dimensions without relying on static reporting alone.
Reporting
Give teams repeatable access to the information required for recurring decisions.
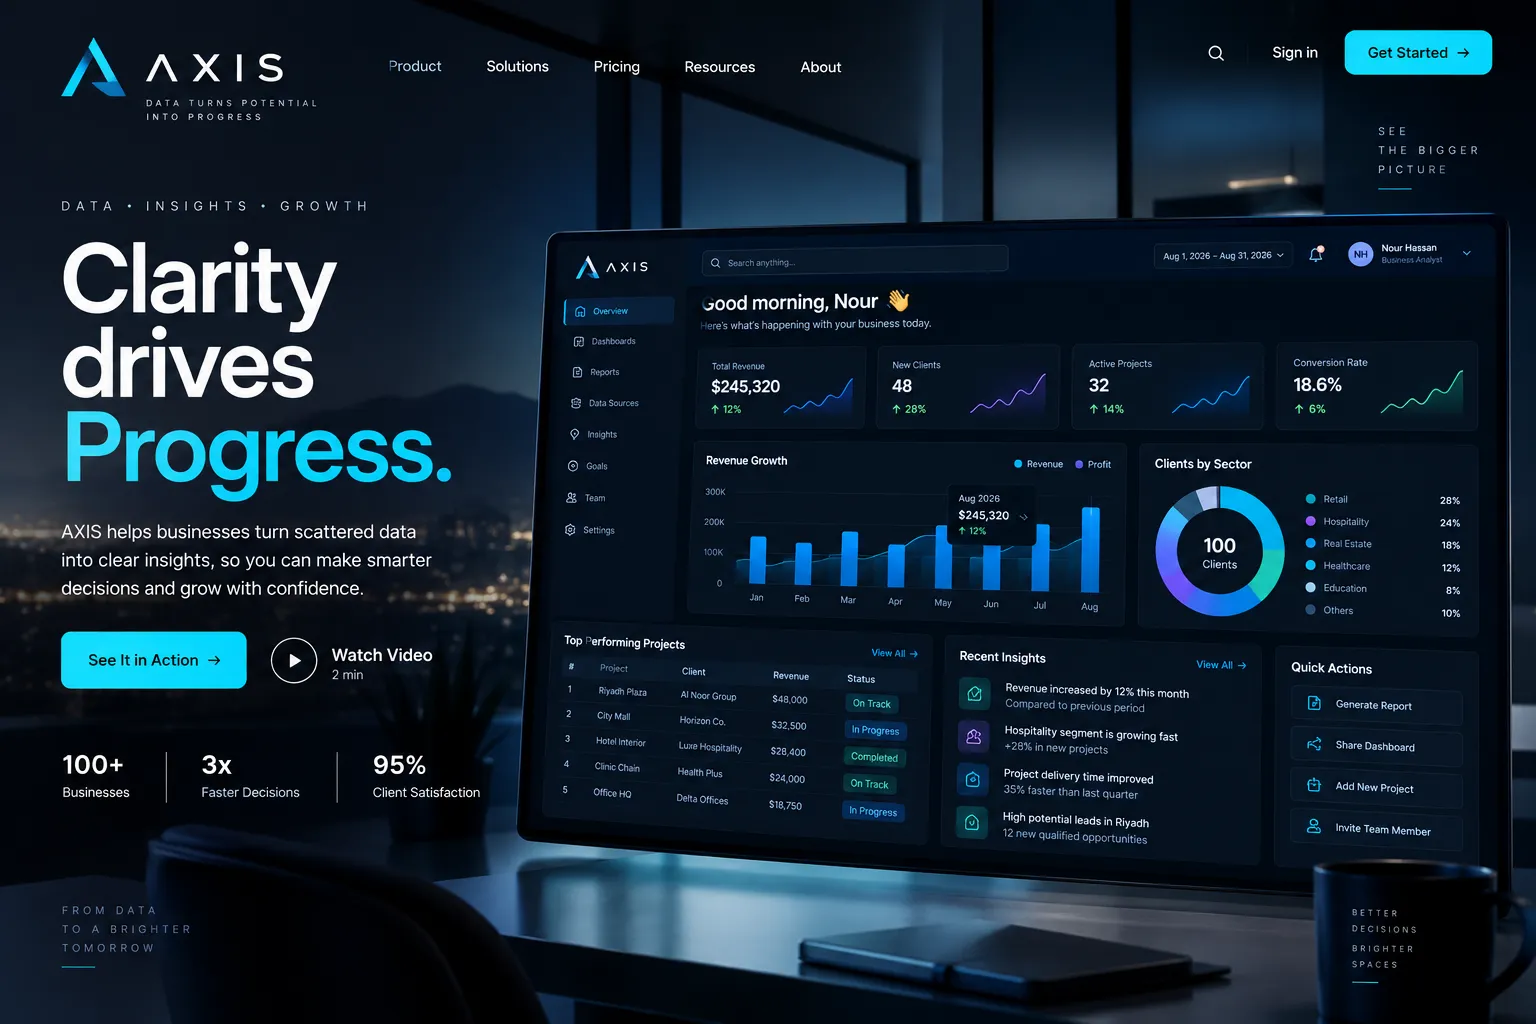
The output isn't a chart.
It's a better question.
Connected data gives management the ability to move beyond collecting reports and start investigating what is actually happening across the business.
Don't start with the dashboard. Start with the data.
AXIS demonstrates CODEVILLE's approach to analytics: understand the business questions, connect the relevant sources, build a reliable data layer, and only then design the views people need to make decisions.